Elixir Orderflow: The Future Of Oscillators
Discover how orderflow analysis can transform your trading by letting you see inside the candles and make educated decisions backed by real data.
Tired of feeling blind when reading charts?
That's because you trade purely based on price action. There is no edge in candlesticks. You are staring at OHLCV (Open-High-Low-Close-Volume) data all day. You will always feel blind, unless you start realizing the only thing that truly matters is orderflow.
Orderflow is like looking inside the candles. The real buy/sell flow of data. This is going to sound stupid easy but... It is the flow of orders.
You could go on your own and learn OI/CVD, Footprint, Market Profile, DOM, AMT, etc.
But we both know your ADHD brain won't follow the amount of data you'll have to learn. That's why I've created Elixir Orderflow.
What is Elixir Orderflow?
Elixir Orderflow is an AIO oscillator letting you see the market with a whole different perspective. Reading things that the chart won't show you and helping you make educated bets on directions with actual data backing it up. It's pretty much like trading with X-Ray vision.
It combines what matters and puts it all together. It is hands down going to change trading forever. It is not like any indicator/oscillator. It is THE MOST POTENT tool a trader can acquire. Nothing compares to it.
Orderflow works on any crypto, any meme coin, any stock, basically anything that has a chart.

The 4 Components
At first glance, it might look very confusing but once you break it down into 4 components, it instantly gets clearer and starts making a lot of sense.
Component #1: Momentum Waves
The dark blue waves are momentum waves. They let you see which side is gaining/losing momentum. Big spike up means it is gaining a lot of positive momentum, big spike down means it is gaining a lot of negative momentum. Momentum curving down means it is losing positive momentum and momentum curving up means positive momentum is increasing.
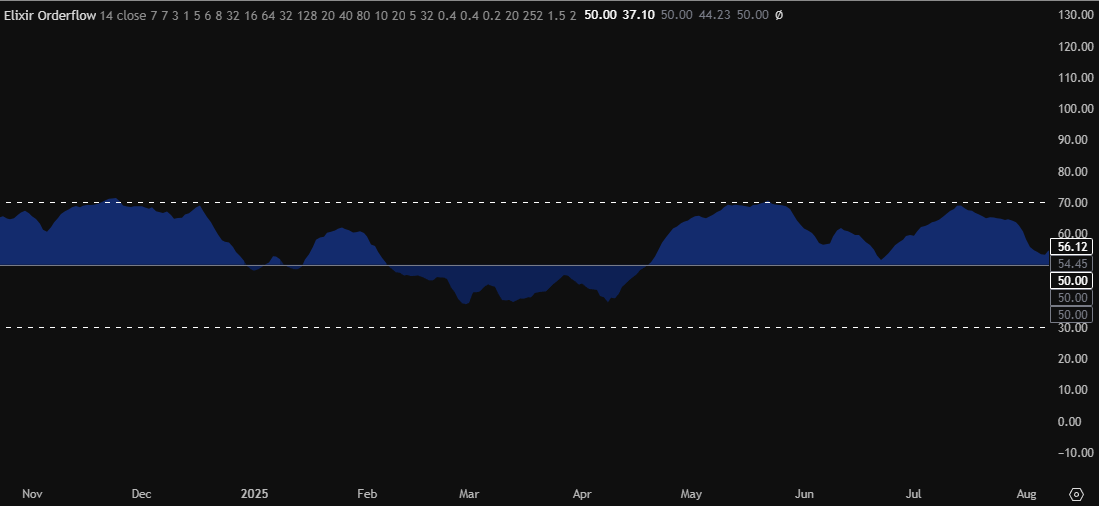
Component #2: Volume Waves
The light blue waves are what I call Volume waves. They show you which side of the market is gaining power over the other. For example, a big spike up means a lot of buy volume is coming in. A big spike down means a lot of sell volume is coming in.

Components #3 & #4: Orderflow Line & Dots
The line itself is a simple RSI line, showing whether the market is getting overbought or oversold. The colors are based on an algorithm calculating Open Interest and Cumulative Volume Delta, which lets you understand whether longs are opening, shorts are opening, longs are closing or shorts are closing.
The dots appear once there is a divergence in RSI & Price, showing an indication of potential reversal of the RSI.

How to Use It All Together
Now that you understand how to use each component, it is time to learn how to use them in harmony. The simplest way of putting it together is to analyze your current environment and understand why the trend might start shifting.
Here's the base strategy that caught almost every move up and down on every time frame.
1Volume Waves
You want a big wave, past the dotted lines followed by a smaller wave later on.

2Momentum Waves
You want to look for momentum waves to start curving towards the side you're trading. For example, if you are trying to long, you want to see momentum curve up and if you are trying to short, you want to see momentum curve down.

3RSI & Orderflow
For extra confirmation, you can wait to see if RSI turns the color you want to trade. For example, if you want to long you can wait for RSI/OF line to turn blue.
4Dots
For maximum confirmation, you can also wait to see if there is a dot appearing where you want to enter. For example, if you want to long you can wait to see a green dot appear in between the volume waves you are trading.

★BONUS: HTF Confluence
The higher the time frame, the stronger the signal gets. So you want to see higher time frames to back you up for best confidence.
Example of Profitable Setups

